Retour au Blog
India Robotics Automation · Part 1 of 9Industry Analysis
The State of Robotics Automation in India: Market Overview and Global Position
India's robotics market has entered a phase of accelerated growth that distinguishes it from almost every other major economy. At 9,120 industrial robot installations in 2024 — making India the world's 6th largest market — the numbers tell a clear story: a market that is small by global standards but growing at an exceptional rate. This is the foundational data layer for understanding where India stands, and where it's headed.
This is the first in a comprehensive research series on robotics automation in India. We capture the market size, growth trajectory, global positioning, and structural composition of India's robotics industry as of early 2026 — backed by data from the International Federation of Robotics (IFR), IMARC Group, and government sources.
India's Robotics Market: Scale and Growth Trajectory
Market Size and Projections
The numbers tell a clear story of a market that is small by global standards but growing at an exceptional rate.
Overall Robotics Market (Industrial + Service)
- ●2025 Market Size: USD 1.98 Billion (Source: IMARC Group)
- ●2034 Projected Size: USD 7.38 Billion
- ●CAGR (2026–2034): 15.74%
Industrial Robotics Segment
- ●2024 Market Size: USD 577.2 Million (Source: Next Move Strategy Consulting)
- ●2025 Market Size: USD 711.1 Million
- ●2030 Projected Size: USD 1,547.6 Million
- ●CAGR (2025–2030): 16.8%
Volume (Industrial Robot Units)
- ●2024: 9,120 units installed (IFR World Robotics 2025, confirmed)
- ●2025: ~10,000 units (estimated)
- ●2030: ~20,000 units (projected)
- ●Volume CAGR (2025–2030): 16.3%
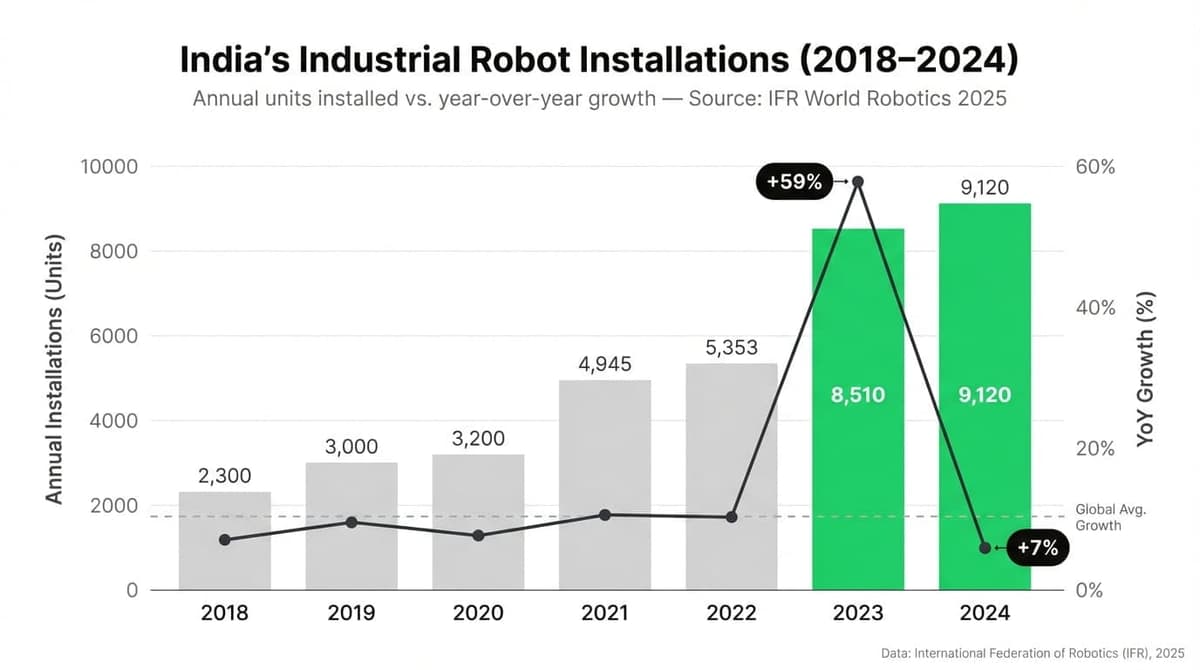
To put this in perspective: India's entire annual robot installation volume in 2024 (9,120 units) is roughly what a single large Chinese automotive plant might install in a year. China installed 276,288 units in 2023 alone (IFR) — more than 30 times India's volume. Yet India's growth rate (59% year-over-year in 2023, 7% in 2024) consistently outpaces most mature markets, signaling that the inflection point is underway.
Why These Numbers Matter
The raw market size numbers can be misleading without context. At USD ~2 Billion, India's robotics market is a fraction of China's (estimated at USD 20+ Billion), Japan's, or Germany's. But several structural factors make the growth rate more significant than the absolute size:
- 1Base Effect: India is starting from a very low base, which means every percentage point of growth adds disproportionate capacity. The operational stock of industrial robots in India was just 44,958 units in 2023 — almost doubling from 2018 levels, per the IFR. By 2024, this reached 52,570 units — placing India 10th worldwide in total operational stock.
- 2Population-Adjusted Potential: India and China have comparable population sizes (~1.4 Billion each). China has over 2 million robots in operation (2,027,000 units as of 2024, per IFR); India has ~52,000. This ~39x gap represents an enormous untapped runway for growth, assuming India's manufacturing ambitions materialize.
- 3Manufacturing GDP Trajectory: India's manufacturing sector contributes roughly 17% of GDP and the government's target is 25%. Every percentage point increase in manufacturing's GDP share, combined with rising labor costs and quality demands, creates structural demand for automation.
Global Positioning: Where India Stands
Installation Rankings
India's ascent in global robot installation rankings has been swift:
| Year | Rank (Annual Installations) | Units Installed | YoY Growth |
|---|---|---|---|
| 2021 | 10th | ~4,945 | — |
| 2022 | ~9th (estimated) | ~5,353 | ~8% |
| 2023 | 7th | 8,510 | 59% |
| 2024 | 6th | 9,120 | 7% |
Source: IFR World Robotics Reports (2023, 2024, 2025)
India now ranks 6th globally in annual installations, behind only China, Japan, the United States, South Korea, and Germany. This is a remarkable jump from 10th place in just three years.
The 2023 spike (59% growth) was primarily driven by the automotive sector, which saw installations surge by 139% to 3,551 units. The moderation to 7% growth in 2024 suggests the automotive boom is stabilizing, and broader sectoral adoption is needed to sustain high growth rates.
The Robot Density Gap — India's Most Telling Metric
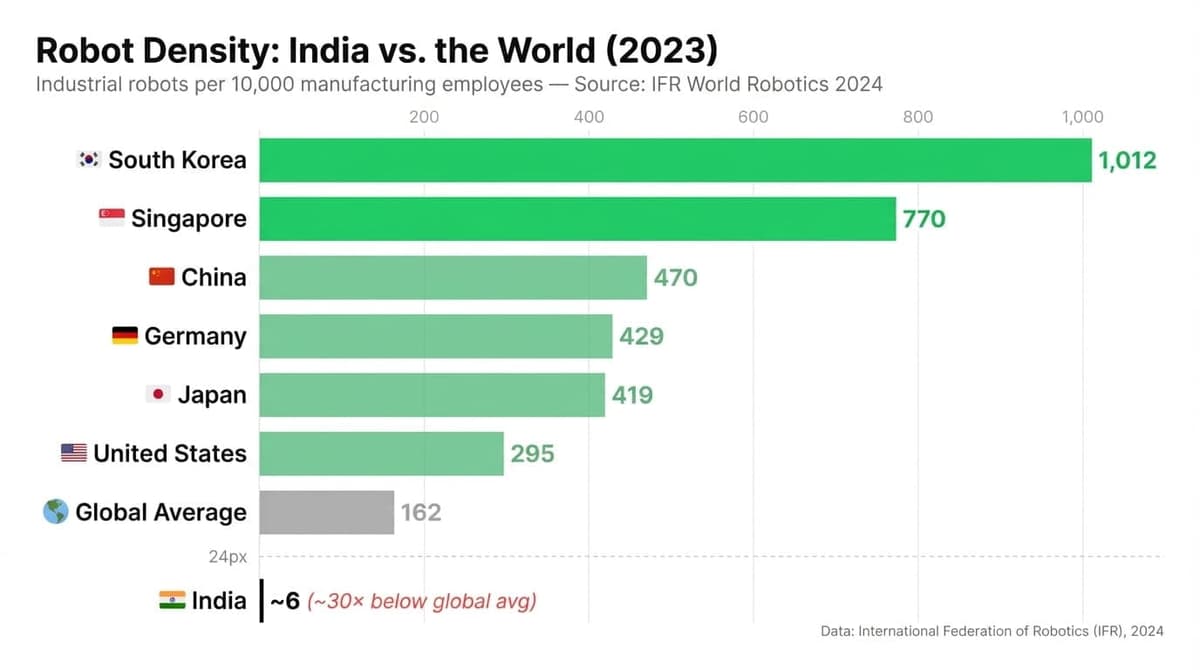
While installation rankings are encouraging, robot density reveals the true depth of India's automation deficit:
| Country | Robot Density (per 10,000 mfg. employees) | Year |
|---|---|---|
| South Korea | 1,012 | 2023 |
| Singapore | 770 | 2023 |
| China | 470 | 2023 |
| Germany | 429 | 2023 |
| Japan | 419 | 2023 |
| United States | 295 | 2023 |
| Global Average | 162 | 2023 |
| India | ~5–7 (estimated) | 2023 |
Source: IFR World Robotics 2024 Report
Key Insight:
India's robot density is estimated at approximately 5–7 robots per 10,000 manufacturing employees — roughly 30x below the global average and 200x below South Korea. This is not merely a gap; it is a chasm that simultaneously represents India's greatest challenge and greatest growth opportunity.
This metric matters because:
- ●It exposes how labor-intensive India's manufacturing remains
- ●It quantifies the headroom for automation adoption
- ●It signals that India's "growth story" in robotics is still in its earliest chapters
Stock vs. Flow: Operational Robots
The distinction between annual installations (flow) and total operational stock is critical:
- ●India's Operational Stock (2024): 52,570 units — 10th worldwide
- ●China's Operational Stock (2024): 2,027,000 units — 1st worldwide (IFR World Robotics 2025). The stock doubled within three years, surpassing 1 million in 2021 and reaching 2 million in 2024.
- ●Japan's Operational Stock (2024): ~450,500 units (IFR World Robotics 2025)
India's stock has more than doubled since 2018 (when it was an estimated ~23,000–25,000 units, based on IFR's statement that stock "almost doubled since 2018" to reach 44,958 in 2023) to ~52,570 units in 2024. While this growth is impressive in percentage terms, the absolute numbers remain small. For comparison, global operational stock reached 4,664,000 robots in 2024 (IFR).
Market Segmentation: What India Buys
By Robot Type
| Robot Type | Market Share (2025) | Primary Use |
|---|---|---|
| Articulated Robots | 39% | Welding, assembly, material handling |
| Cartesian/Linear Robots | ~18% | Pick-and-place, CNC loading |
| SCARA Robots | ~15% | Electronics assembly, packaging |
| Collaborative Robots (Cobots) | Growing rapidly | Human-robot shared workspaces |
| AMRs & AGVs | Emerging | Warehouse logistics, material transport |
| Cylindrical/Others | ~10% | Specialized applications |
Source: IMARC Group, 2025
Articulated robots dominate because India's largest robotics customer — the automotive sector — relies heavily on multi-axis robotic arms for welding, painting, and assembly. SCARA robots are gaining traction in electronics and pharmaceutical packaging, sectors where India is expanding production under PLI (Production-Linked Incentive) schemes.
Key Insight:
The emerging growth of collaborative robots (cobots) and Autonomous Mobile Robots (AMRs) is particularly significant for India. Cobots have lower capital costs, require less floor space, and can work alongside existing human workers — making them ideal for India's prevalent SME landscape where full automation is neither affordable nor practical.
By Application
| Application | Market Share (2025) | Notes |
|---|---|---|
| Material Handling | 30% | Palletizing, logistics, pick-and-place |
| Welding & Soldering | ~22% | Dominated by automotive |
| Assembly & Disassembly | ~18% | Electronics, automotive sub-assembly |
| Processing | ~12% | Machining, cutting, grinding |
| Dispensing | ~8% | Adhesives, coatings, pharma |
| Cleanroom | ~5% | Semiconductor, pharma |
| Others | ~5% | Inspection, testing |
Source: IMARC Group, 2025
Material handling is the largest application segment globally, and India follows this pattern. The rise of e-commerce, organized retail, and third-party logistics (3PL) in India is creating new demand for automated handling systems beyond traditional manufacturing.
By End-Use Industry
| Industry | Market Share (2025) | Trend |
|---|---|---|
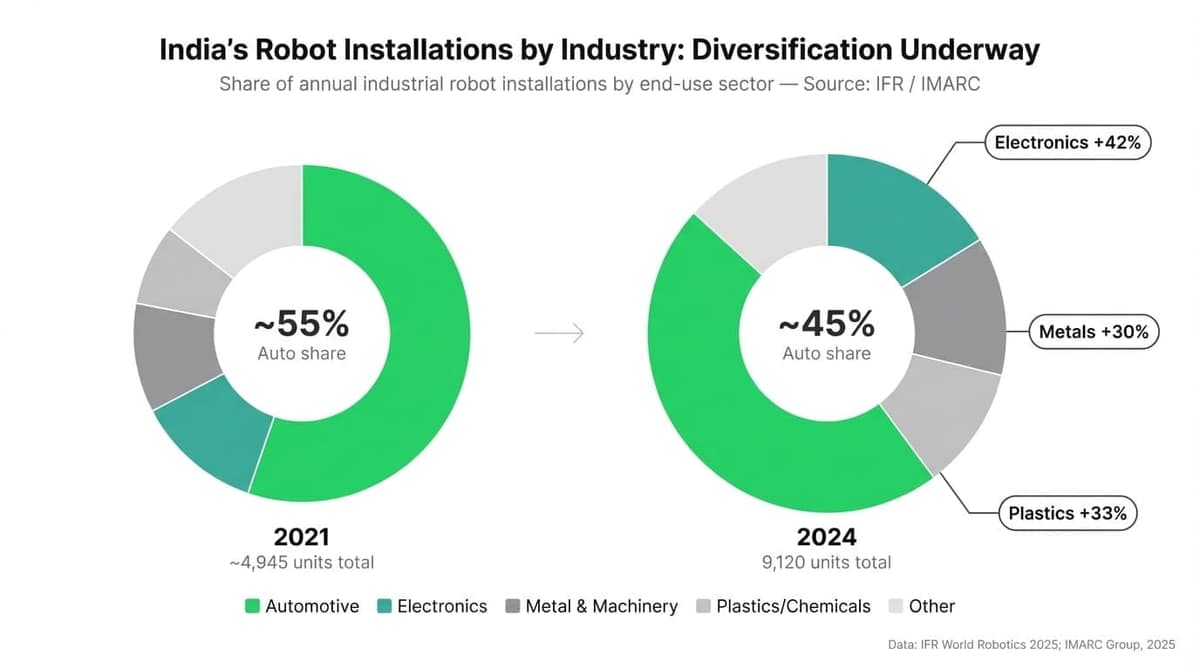
| Automotive | 36% | Dominant, 139% installation growth in 2023 |
| Electronics & Semiconductor | ~18% | Growing fast under PLI |
| Metal & Machinery | ~12% | 30% growth in installations (2024) |
| Plastic & Chemical Products | ~10% | 33% growth in installations (2024) |
| Pharmaceuticals | ~8% | Driven by quality/compliance |
| Food & Beverages | ~7% | Emerging; hygiene-driven |
| Logistics & Warehousing | ~5% | Exploding with e-commerce growth |
| Others | ~4% | Textiles, construction, etc. |
The automotive sector's dominance mirrors the global pattern, but India's story has a specific nuance: the massive push for electric vehicle (EV) manufacturing is creating entirely new production lines that are being designed robot-first, rather than retrofitting robots into existing manual lines. Companies like Tata Motors, Mahindra, and Ola Electric are building new plants with significantly higher automation levels than India's legacy factories.
The general industry segment (non-automotive) showed strong diversification in 2024, with plastics/chemicals (+33%) and metals (+30%) growing faster than automotive. This diversification is crucial for sustained market growth — over-dependence on a single sector makes the market cyclical and fragile.
Source: IMARC Group (market share by value). Note: By unit installations, IFR World Robotics 2025 reports automotive at approximately 45% of India's total installations in 2024 (4,070 out of 9,120 units), reflecting the sector's dominance in installation volumes even more starkly than in value terms.
By Region
| Region | Market Share (2025) | Key Industrial Hubs |
|---|---|---|
| North India | 32% | Delhi-NCR, Haryana (Gurugram, Manesar), Punjab |
| West India | ~28% | Maharashtra (Pune, Mumbai), Gujarat (GIFT City, Ahmedabad) |
| South India | ~25% | Tamil Nadu (Chennai), Karnataka (Bengaluru), Telangana |
| East India | ~15% | West Bengal, Odisha (emerging steel/mining) |
Source: IMARC Group
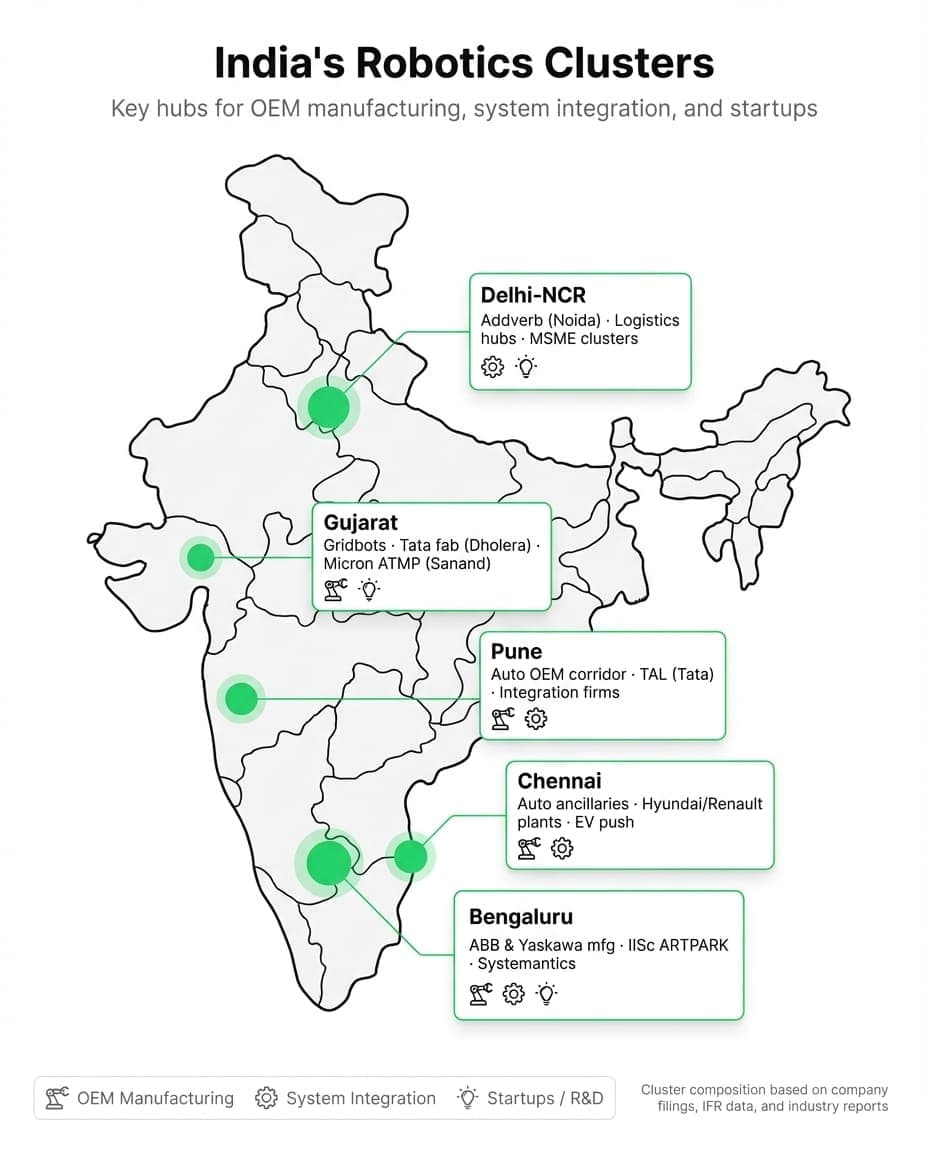
North India leads due to the concentration of automotive manufacturing (Maruti Suzuki's Manesar/Gurugram complex, Hero MotoCorp's plants) and the logistics infrastructure around Delhi-NCR. However, South India — particularly Tamil Nadu's Chennai-Hosur corridor — has the highest density of automotive ancillary manufacturers and is arguably the most "automation-ready" region in terms of workforce skill levels and existing technology infrastructure.
Key Market Players in India
Global Players Operating in India
The Indian market is overwhelmingly served by global robotics OEMs who have established sales offices, service centers, and in some cases, manufacturing or assembly operations in India:
| Company | Headquarters | India Presence | Notable Products |
|---|---|---|---|
| ABB | Switzerland | Manufacturing in Bengaluru; major local presence | IRB series articulated robots, cobots |
| Fanuc | Japan | Sales & service offices; growing presence | CNC robots, factory automation |
| Yaskawa | Japan | Manufacturing plant in Bengaluru | Motoman series, drives |
| KUKA | Germany (Midea-owned) | Sales/service presence | Industrial robots, mobile platforms |
| Universal Robots | Denmark (Teradyne) | Growing cobot market presence | UR3e/UR5e/UR10e/UR20 cobots |
| Mitsubishi Electric | Japan | Factory automation division | SCARA, articulated robots |
| Siemens | Germany | Major industrial automation presence | Digital twins, factory software |
| Omron | Japan | Sales & service | Cobots, mobile robots |
ABB stands out with its Bengaluru manufacturing facility, where it produces robots and drives for both the Indian market and export. Yaskawa similarly manufactures in Bengaluru. These local manufacturing operations are significant because they reduce costs, improve service turnaround, and create a local supply chain ecosystem.
Indian Companies in Robotics
While indigenous robotics OEM capability remains limited compared to global players, several Indian companies are building presence:
- ●TAL Manufacturing (Tata Group): Developed BRABO, India's first indigenously designed and manufactured industrial robot, targeted at SMEs
- ●Systemantics: Bengaluru-based, India's pioneer in industrial collaborative robots (cobots), with expertise in underwater robots and walking machines for specialized environments
- ●Addverb Technologies: Noida-based, specializing in warehouse automation, AMRs, and sortation systems — widely regarded as India's largest robotics company (majority stake held by Reliance Retail since 2022)
- ●GreyOrange: Founded in India (now HQ in Atlanta), builds AI-driven warehouse robots
- ●Gridbots: Ahmedabad-based, builds robots for defense, nuclear, and underwater applications
- ●Bangalore Automation & Robotics (BaR): Industrial automation and robotic integration
Key Insight:
The gap between Indian companies and global OEMs is significant in traditional industrial robotics. However, Indian companies are finding success in application-specific niches — warehouse automation (Addverb), affordable cobots for SMEs (TAL BRABO), and defense/specialized environments (Gridbots, Systemantics).
Growth Drivers: Why Now?
Rising Labor Costs in Organized Manufacturing
India's traditional competitive advantage — cheap labor — is eroding in organized sectors. Minimum wages in manufacturing hubs like Maharashtra, Tamil Nadu, and Haryana have been rising 8–12% annually. More importantly, the effective cost of labor (including compliance, benefits, training, absenteeism, and turnover) is rising faster than headline wage numbers.
For tasks requiring precision and consistency — welding, electronics assembly, quality inspection — the ROI calculus for robots is increasingly favorable. A collaborative robot costing INR 15–25 lakh (USD ~18,000–30,000) can often achieve payback in 18–24 months in organized manufacturing environments.
Government Push: Make in India, PLI, and the National Strategy on Robotics
Multiple government initiatives are converging to create a policy environment favorable to automation:
- ●Make in India (2014–present): The flagship initiative to grow manufacturing's GDP share to 25% inherently requires automation to achieve the productivity levels needed to compete globally.
- ●Production-Linked Incentive (PLI) Schemes: Covering 14 sectors including electronics, automotive, pharmaceuticals, telecom, and textiles — PLI schemes provide financial incentives (typically 4–6% of incremental sales, varying by sector) that make modernization investments, including robotics, more financially viable. The PLI scheme, with a government incentive outlay of INR 1.91 lakh crore, has attracted approved investment commitments of over INR 2.16 lakh crore (USD ~26 Billion) across 836 approved applications as of December 2025 (Source: PIB / Ministry of Commerce & Industry), generating sales exceeding INR 20.41 lakh crore and employment for over 14.39 lakh people. Separately, the Electronics Components Manufacturing Scheme (ECMS) — distinct from the original 14-sector PLI — saw its outlay nearly doubled from ~INR 22,919 crore to INR 40,000 crore in the Union Budget 2026–27, reflecting the government's intensifying focus on electronics self-sufficiency.
- ●Draft National Strategy on Robotics (MeitY, 2023): Explicitly aims to enhance R&D capabilities, establish Centers of Excellence (CoEs), create regulatory sandboxes for robotics, and fund "Moonshot Projects" for breakthrough innovation in manufacturing, agriculture, healthcare, and national security.
- ●Semiconductor Mission: The India Semiconductor Mission (ISM), with an outlay of INR 76,000 crore (~USD 10 Billion at 2021 exchange rates; Source: PIB), is catalyzing advanced manufacturing facilities. Tata Electronics is building a semiconductor fabrication plant in Dholera, Gujarat (~INR 91,000 crore), while Micron Technology opened its semiconductor assembly and test (ATMP) facility in Sanand, Gujarat in February 2026 (~USD 2.75 Billion combined investment). ISM 2.0 was announced in the Union Budget 2026–27 to deepen domestic manufacturing, design IP, and supply chains. These facilities will be among the most automated manufacturing environments ever built in India.
Quality and Compliance Demands
As Indian manufacturers integrate into global supply chains — particularly in automotive, aerospace, electronics, and pharmaceuticals — they face international quality standards (ISO, IATF 16949, FDA compliance) that are difficult to meet consistently with manual processes. Robots offer the repeatability and traceability that global buyers demand.
E-Commerce and Logistics Transformation
India's e-commerce market is growing at 25%+ annually, with platforms like Flipkart, Amazon India, Meesho, and JioMart driving explosive demand for warehouse automation. The 3PL (third-party logistics) industry is professionalizing, with companies like Delhivery, Ecom Express, and Shadowfax investing in automated sortation, AMRs, and robotic pick-and-place systems.
Demographic Shift and Labor Availability
While India has a young population, there is a paradox: manufacturing is increasingly struggling to attract and retain workers in certain roles. Young Indians are preferring service sector jobs, gig economy work, and education over factory floor positions. This is creating localized labor shortages in specific manufacturing clusters, accelerating automation out of necessity rather than purely cost optimization.
Structural Challenges and Headwinds
High Capital Costs and SME Barriers
India's manufacturing sector is heavily dominated by MSMEs (Micro, Small, and Medium Enterprises), which account for ~45% of manufacturing output. The capital cost barrier is not merely about the price of a robot — it is about the total system cost and the financing ecosystem around it.
A basic 6-axis industrial robot system (robot + controller + end-effector + safety fencing + integration) costs INR 25–60 lakh (USD 30,000–72,000). For a small metalworking shop in Ludhiana or Rajkot with annual revenue of INR 2–5 crore and profit margins of 5–10%, this represents 1–3 years of profit committed to a single machine. Bank financing for robotic equipment is difficult because robots are not standard collateral categories — unlike CNC machines or factory buildings, which have established resale value frameworks.
The RaaS (Robotics-as-a-Service) model, where companies lease robots rather than buying them, offers a theoretical solution by converting CapEx to OpEx. But RaaS in India remains nascent — only a handful of companies (Ati Motors, some Addverb deployments) offer production-ready pay-per-use models. For the RaaS ecosystem to mature, India needs both more robot service providers and an insurance/maintenance infrastructure that does not yet exist at scale.
Skill Gap
Operating, programming, and maintaining robots requires a skill set that India's education system does not adequately produce. The gap exists at every level:
- ●Operator level: Factory workers need training to interact safely with robotic systems, load/unload parts, and perform basic fault recovery.
- ●Programmer level: Engineers must know teach-pendant programming, offline programming from CAD models, and increasingly, AI-based path planning and vision system configuration.
- ●Integration level: System designers must understand the specific manufacturing process (welding metallurgy, assembly tolerances, paint film thickness) as deeply as they understand the robot itself — because robot programming is meaningless without process knowledge.
India's ~3,500 engineering colleges produce 1.5 million graduates annually, but fewer than 5% receive any hands-on exposure to industrial robots. The few institutions with robotics labs (IIT Madras, IISc through ARTPARK, IIIT Hyderabad) produce perhaps a few hundred graduates per year with practical robotic skills. OEM training programs (ABB Academy, FANUC Training Centre) exist but are expensive (INR 50,000–2,00,000 per course) and reach limited numbers. The result is a persistent mismatch: thousands of robots are being sold into a market where there are not enough people qualified to deploy, program, and maintain them.
Infrastructure Limitations
Reliable power supply, stable internet connectivity (required for Industry 4.0 / IoT-connected robots), and adequate factory floor infrastructure remain serious challenges outside Tier-1 industrial clusters. A robotic cell requires clean, stable power — voltage fluctuations can damage servo drives worth lakhs of rupees. Factory floors must be level, well-lit, and organized with clear safety zones. Many Indian MSME workshops were built for manual work and lack these basic prerequisites.
The connectivity dimension is increasingly important as robots become networked. Fleet management of warehouse AMRs, remote monitoring, predictive maintenance, and cloud-based analytics all require reliable internet that many Indian factories — particularly those outside Mumbai, Pune, Bengaluru, Chennai, and the NCR belt — do not have. This infrastructure gap creates a two-speed India: automated, connected factories in metro industrial zones, and manual, disconnected workshops everywhere else.
Cultural and Organizational Resistance
In many Indian organizations, automation is still perceived as "replacing workers" rather than "augmenting capabilities." Union opposition in sectors like automotive and steel has historically slowed automation projects, particularly in public sector enterprises. Management hesitation arises because many factory owners are first-generation entrepreneurs who built their businesses on labor-intensive models and are deeply uncomfortable delegating production to machines they do not fully understand. Worker anxiety is real — in a country where social safety nets are limited, losing a factory job has existential consequences that it does not carry in Scandinavian or German economies with robust unemployment insurance.
Key Insight:
The most effective countermeasure, consistently reported across case studies, is not argument but demonstration. Once a factory owner sees a robot successfully operating on their own product — on their own floor, with their own workers alongside it — the resistance collapses. This is why demonstration centers, trial programs, and RaaS models that let companies try robots before committing are so important.
Limited Domestic Manufacturing of Robots
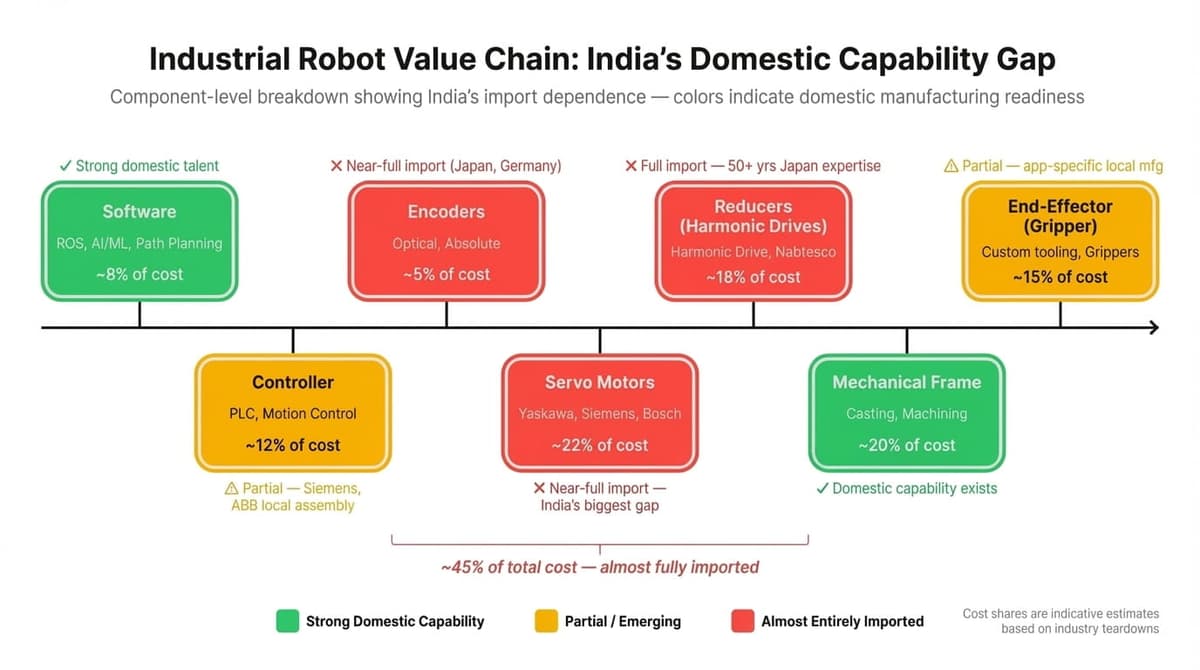
India does not manufacture the core components of industrial robots at scale. Precision servo motors (Yaskawa, Siemens, Bosch Rexroth), harmonic drive reducers (Harmonic Drive Systems, Nabtesco), high-resolution optical encoders, and advanced motion controllers are almost entirely imported from Japan, Germany, and increasingly China.
This import dependence has three consequences: it makes robots more expensive in India (import duties of 7.5–22% plus logistics add 15–30% to the landed cost), it creates supply chain vulnerability (lead times of 8–16 weeks for critical components), and it means India captures little value from the robots it deploys.
There are early signs of domestic component capability — PLI schemes for electronics and advanced chemistry cells (batteries) are building adjacent supply chains, and companies like Addverb manufacture complete AMR systems domestically. But in precision mechanical components — the harmonic drives and servo motors that are the heart of articulated robots — India remains almost entirely dependent on imports. Building this capability requires not just investment but deep process knowledge (thermal management, precision grinding, materials science) that takes decades to develop. Japan's dominance in harmonic drives, for instance, rests on 50+ years of accumulated manufacturing expertise.
Market Outlook: 2026 and Beyond
Near-Term Trajectory (2026–2028)
The expectation is for continued double-digit growth in installations, driven by:
- ●Ongoing automotive investments (EV plants by Tata, Mahindra, Hyundai India)
- ●Semiconductor facility construction (Tata Electronics fab in Dholera; Micron ATMP in Sanand) bringing ultra-high automation demand
- ●Electronics manufacturing expansion under PLI (Foxconn, Pegatron, Dixon Technologies)
- ●Logistics automation scaling with e-commerce growth
India is expected to cross 10,000+ annual industrial robot installations by 2025 and potentially reach 15,000–20,000 by 2028, which would bring it closer to the top 5 globally.
Medium-Term Inflection Points (2028–2032)
Several factors could accelerate India's robotics adoption beyond current projections:
- ●Robotics-as-a-Service (RaaS): Pay-per-use/leasing models that eliminate upfront capital barriers for SMEs
- ●AI-Integrated Robotics: Machine vision, large language model-driven programming, and adaptive control making robots easier to deploy without deep expertise
- ●Cobot Proliferation: As cobots become cheaper (sub-USD 15,000 units from Chinese manufacturers), adoption in small workshops becomes viable
- ●Service Robotics Explosion: Healthcare, agriculture, hospitality, and security robotics creating entirely new market segments beyond manufacturing
The China Comparison: Instructive but Not Prescriptive
India frequently benchmarks against China's robotics trajectory. China's robot density went from ~49 per 10,000 workers in 2015 to 470 in 2023 — a 10x increase in 8 years. Can India replicate this?
The honest answer is: not at the same pace, and not through the same model. China's robotics explosion was driven by massive state subsidies, a concentration of electronics manufacturing (which uses more robots per dollar of output than automotive), and a deliberate policy to move up the value chain from low-cost assembly to high-tech manufacturing. India's path will be different — more gradual, more distributed across sectors, and more influenced by the SME segment.
Key Insight:
India does not need to match China's pace to succeed. If India can double its robot density from ~5–7 to ~15 per 10,000 workers by 2030, that alone would represent a massive productivity transformation worth hundreds of billions in manufacturing value-add.
Key Takeaways
- 1India is the world's 6th largest market for annual industrial robot installations (2024 data), up from 10th in 2021 — a rapid ascent driven primarily by automotive.
- 2The robot density gap is staggering: India's ~5–7 robots per 10,000 manufacturing workers compares to a global average of 162 and South Korea's 1,012. This gap is simultaneously India's greatest challenge and greatest growth opportunity.
- 3The market is real but still small in absolute terms: USD ~2 Billion across all robotics in 2025, projected to reach ~USD 7.4 Billion by 2034 at a 15.7% CAGR.
- 4Automotive dominates, but diversification is underway: ~45% of unit installations (IFR, 2024) and 36% of market value (IMARC, 2025), but metals, chemicals, electronics, and logistics are growing faster in percentage terms.
- 5Government policy is directionally supportive: PLI, Make in India, the National Strategy on Robotics, and the Semiconductor Mission all create tailwinds. However, there is no dedicated, funded "National Robotics Mission" at the scale seen in China, South Korea, or Japan.
- 6The biggest barriers are structural: Capital cost for SMEs, skill gaps, limited domestic manufacturing of robot components, and cultural resistance to automation.
- 7The next 3–5 years will determine the trajectory: If India can crack the SME adoption problem (via RaaS, cobots, easier programming), build a skilled workforce, and develop even a partial domestic supply chain, it could shift from "promising" to "transformational."
What's Next in This Series
This article established the foundational data layer — market size, global positioning, sectoral composition, and structural context. The remaining eight articles in this series go deeper:
- 1Industrial Robotics Sector Deep Dive: Automotive, electronics, metals, pharmaceuticals, and food processing — where robots are actually being deployed, what's working, and what's blocked
- 2Service and Healthcare Robotics: Surgical systems, rehabilitation robots, hospitality, and consumer robotics — the emerging dominant revenue segment
- 3Agriculture, Warehouse, and Logistics Robotics: India's most distinctive opportunities — 150+ million farms meeting drone technology, and e-commerce reshaping warehouse automation
- 4Defence and Space Robotics: Unmanned systems, autonomous platforms, and ISRO's robotics ambitions — where sovereignty and national prestige drive adoption
- 5Startups and Ecosystem: Who is building robots in India, where they're concentrated, how they're funded, and the institutional infrastructure behind them
- 6Policy, Education, and Talent: The National Strategy on Robotics, regulatory frameworks, and the workforce pipeline that will determine whether India's ambitions can scale
- 7Investment and Business Outlook: Where capital is flowing, return profiles, global positioning, and what makes India attractive (or unattractive) for robotics investment
- 8Gaps, Challenges, and Future Roadmap: A synthesis of structural gaps across all preceding analyses, and a realistic roadmap for what comes next
Each article combines primary-source data with practical analysis for decision-makers operating in this market.
Our Perspective
At Robolabs AI, we work at the intersection of robotics, computer vision, and industrial automation. Our team has hands-on experience deploying perception systems, robotic manipulation stacks, and automation solutions across manufacturing, logistics, and inspection environments — and we've seen firsthand how India's automation landscape differs from the textbook narratives.
This research series draws on that operational experience. The data points and structural analysis presented here are not academic exercises — they reflect the questions our clients and partners ask when evaluating automation investments in India. We publish this work to contribute to a more informed conversation about where the market actually stands, beyond the headlines.
If you're navigating automation decisions — whether evaluating your first robotic cell, scaling an existing deployment, or assessing the Indian market for investment — we welcome the conversation.
References & Further Reading
1
International Federation of Robotics (IFR). "World Robotics 2025 Report: India Rises to Sixth in Global Factory Robot Installations." September 2025. — IFR is the global industry body that collects the authoritative dataset on industrial robot installations and operational stock worldwide.
4
PIB (Press Information Bureau). "Production Linked Incentive Scheme with ₹1.91 Lakh Crore Outlay." 2026. — Official Government of India source for PLI scheme data.
6
PM India / Cabinet. "India Semiconductor Mission." — Official source for ISM allocation (₹76,000 crore) and approved semiconductor units.
9
IMARC Group. "India Robotics Market Size, Share, Trends and Forecast, 2026-2034." — Source for overall India robotics market size (7.38B by 2034). Commercial market research — projections are estimates.
10
Next Move Strategy Consulting. "India Industrial Robotics Market Analysis, 2025–2030." — Source for industrial robotics dollar market size.
12
IBEF. "India's Rise of the Robots: Country Among Top 10 Markets in Installations." — Note: IBEF is a government trust; framing may carry optimistic bias.
13
Universal Robots. "Harnessing Automation: India's Next Manufacturing Leap." — Note: Commercial interest in promoting Indian automation market.
15
Xinhua. "China leads global industrial robot market with record installations: IFR." September 2025. — Source for China market specifics (2,027,000 stock in 2024).
India Robotics AutomationPart 1 of 9
Abonnez-vous à notre Blog
Recevez les dernières actualités sur la robotique et l'IA dans votre boîte mail.
Pas de spam. Désabonnement à tout moment.
You Might Also Like
View all posts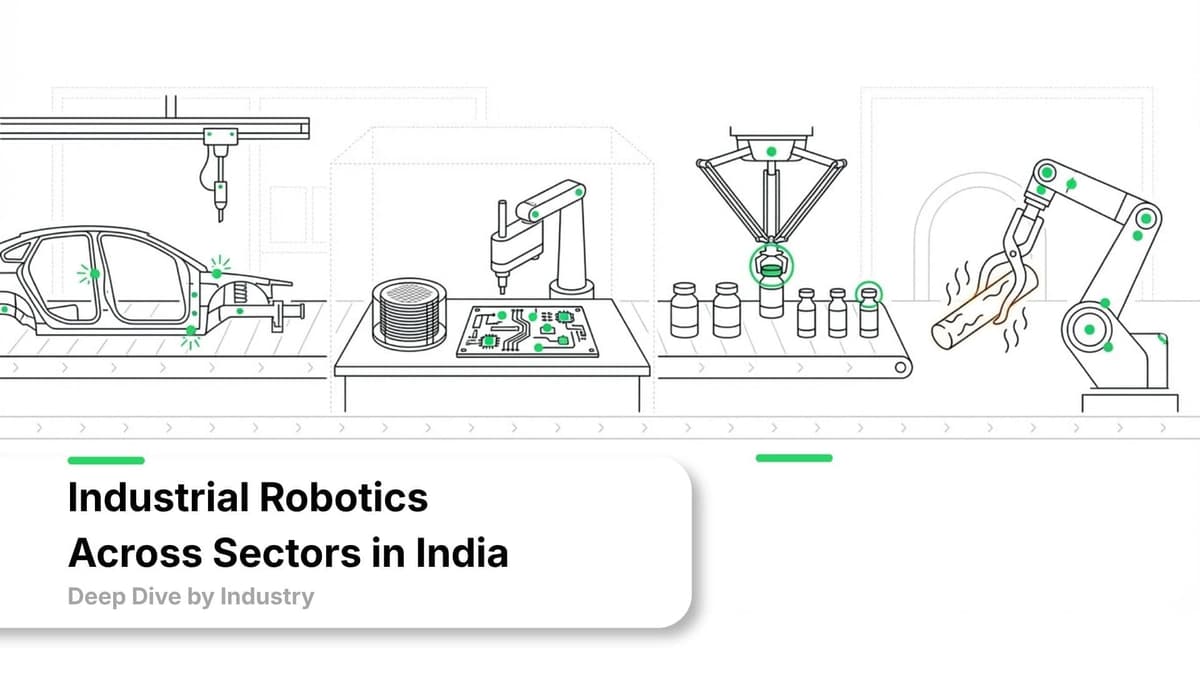
Industry Analysis
Industrial Robotics Across Sectors in India: Deep Dive by Industry
A sector-by-sector analysis of industrial robotics adoption in India — automotive, electronics, semiconductor, metals, plastics, pharma, food processing, textiles, and heavy engineering. Where robots are deployed, what's working, and where the next wave comes from.
Mar 30, 202625 min read
Industry Analysis
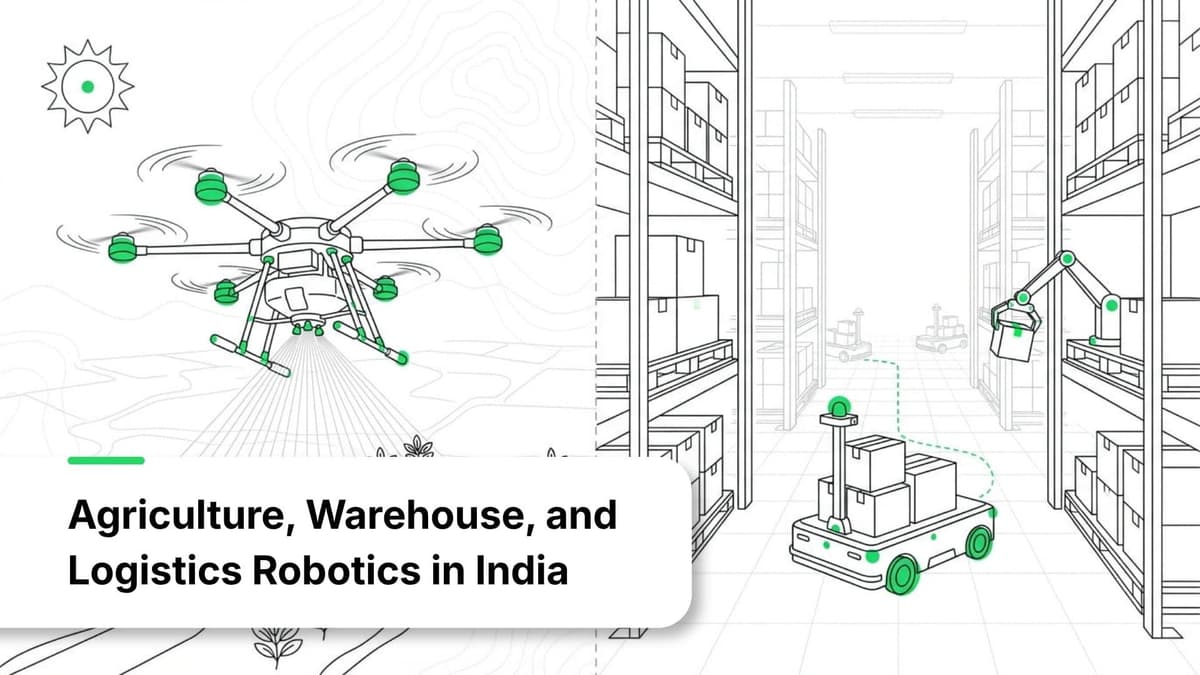
Agriculture, Warehouse, and Logistics Robotics in India
A data-driven analysis of India's most distinctive robotics opportunities — agricultural drones (Kisan Drone, Namo Drone Didi, 38,500+ registered drones), warehouse automation (USD 560M market, Addverb, GreyOrange, Unbox Robotics, quick-commerce fulfillment), cold chain robotics, drone delivery, and the farm-to-consumer automation chain.
Apr 9, 202623 min read
Industry Analysis
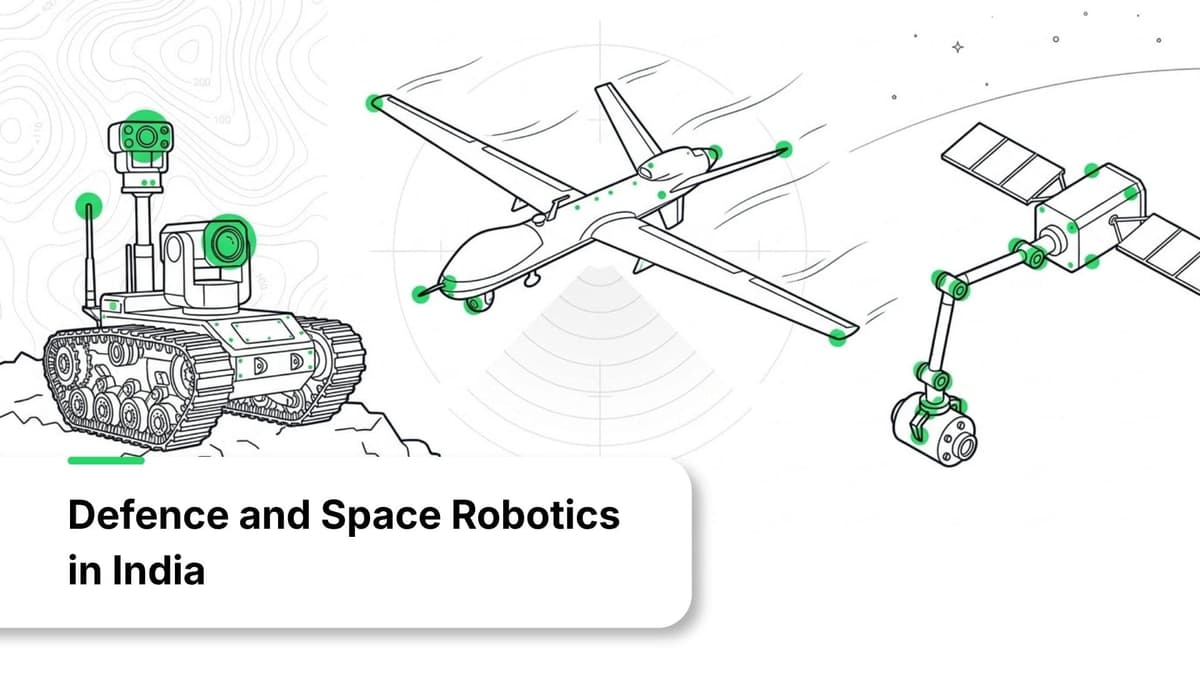
Defence and Space Robotics in India
A strategic analysis of India's defence and space robotics ecosystem — military UAVs (IdeaForge, Adani-Elbit Hermes 900, DRDO TAPAS-BH, HAL CATS), unmanned ground vehicles (AeroArc Robotic MULE, Bhairav Robotics Shvana), underwater robotics (DRDO MP-AUVs, EyeROV TUNA), swarm drones, the Atmanirbhar Bharat defence push (1,000+ startups, USD 247M investments in 2025), ISRO's Pragyan lunar rover, SpaDeX robotic arm in space, Vyommitra humanoid for Gaganyaan, and India's 2035 space station roadmap.
Apr 19, 202623 min read
Prêt à Construire Quelque Chose d'Impactant ?
Discutons de la façon dont notre équipe peut vous aider à concrétiser votre vision en IA et robotique.